Short separation channels: the new trend in fNIRS
In this blog, we will explore the current use and advantage of short separation channels. We will clarify the reason why researchers apply short channels and give insight into the number of short channels that can be used. A brief example of the implementation of a short channel for your data analysis in OxySoft will be given. Additionally, we provide a convenient overview of our devices which are compatible with short separation channels.
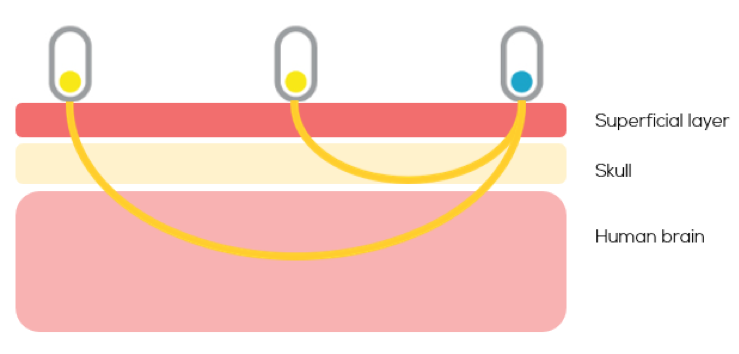
Short separation channels are the new trend in fNIRS. However, what is the functionality of such a short separation channel? Quite counter-intuitively, we will start by discussing the long channel. A long channel (also referred as deep channel) has a relative large interoptode distance and thereby is able to measure the concentration changes in hemoglobin relative deep in the tissue. Based on the principles of photon migration, the maximum measuring depth is approximately half the interoptode distance. For example, a distance of 30 mm between transmitter and receiver means you can measure 15 mm deep. By using a long, deep channel you can measure optical changes in the human brain. Since hemoglobin is the main absorber, fNIRS can measure the concentration changes of oxy- and deoxyhemoglobin.
Figure 1: Measuring depth of a long channel and a short separation channel
The local hemoglobin change in human tissue consists of many different signal component; e.g. hemodynamic responses, blood pressure waves, Mayer waves, respirational changes, cardiac cycle (Zhang et al., 2007). Research focusses mainly on the hemodynamic response component of this signal. To eliminate the other signal components, one needs to filter the acquired signal.
A new strategy for isolating the hemodynamic response signal involves short separation channels. A short separation channel measures solely the extracerebral signals (Figure 1), which includes blood pressure waves, Mayer waves, respiration and cardiac cycles. The signal components of the short separation channel can be seen as the “noise” in the signal of the long channel (Brigadoi and Cooper, 2015). By removing these components from the long channel, you can minimize this noise.
There are many different methods and algorithms to analyze a short separation channel. An easy method is to subtract the short channel from your long channel. In figure 2, an example of the correction of a long channel using short channel data of a fingertipping task in Oxysoft is given. Other more advanced analysis methods are using a static estimator, adaptive least mean square method (Sato et al., 2016) or a Kalman filter (Scarpa et al., 2013).
Figure 2: Reduction in physiological "noise" by subtracting short separation channel (extracerebral) data from long channel (extracerebral + intracerebral)
Furthermore, you should consider the number of short separation channel you would like to implement in your fNIRS system. There are several possibilities for short separation channels (SSC).
Local: Use one SSC for each long channel
Symmetrical-local: Use one SSC for each symmetrical channel
Symmetrical-region: Use one SSC for each symmetrical region
Global-ipsilateral: Use one SSC for each hemisphere
Global-contralateral: Use one SSC for the entire head
In Figure 3, a 16-channel optode template is presented to clarify the categories for using short separation channels. Each color represents a short separation channel needed for a long channel based on the different categories. In the article of Zhang et al., 2015, you can read more about the correlation between the locations of the short separation channels and the components of the signals.
Figure 3: 16-channel optode template set-up for local, symmetrical-local, symmetrical-region, global-ipsilateral and global-contralateral use of short separation channels. Each color represent a short separation channel for every category of long channels.
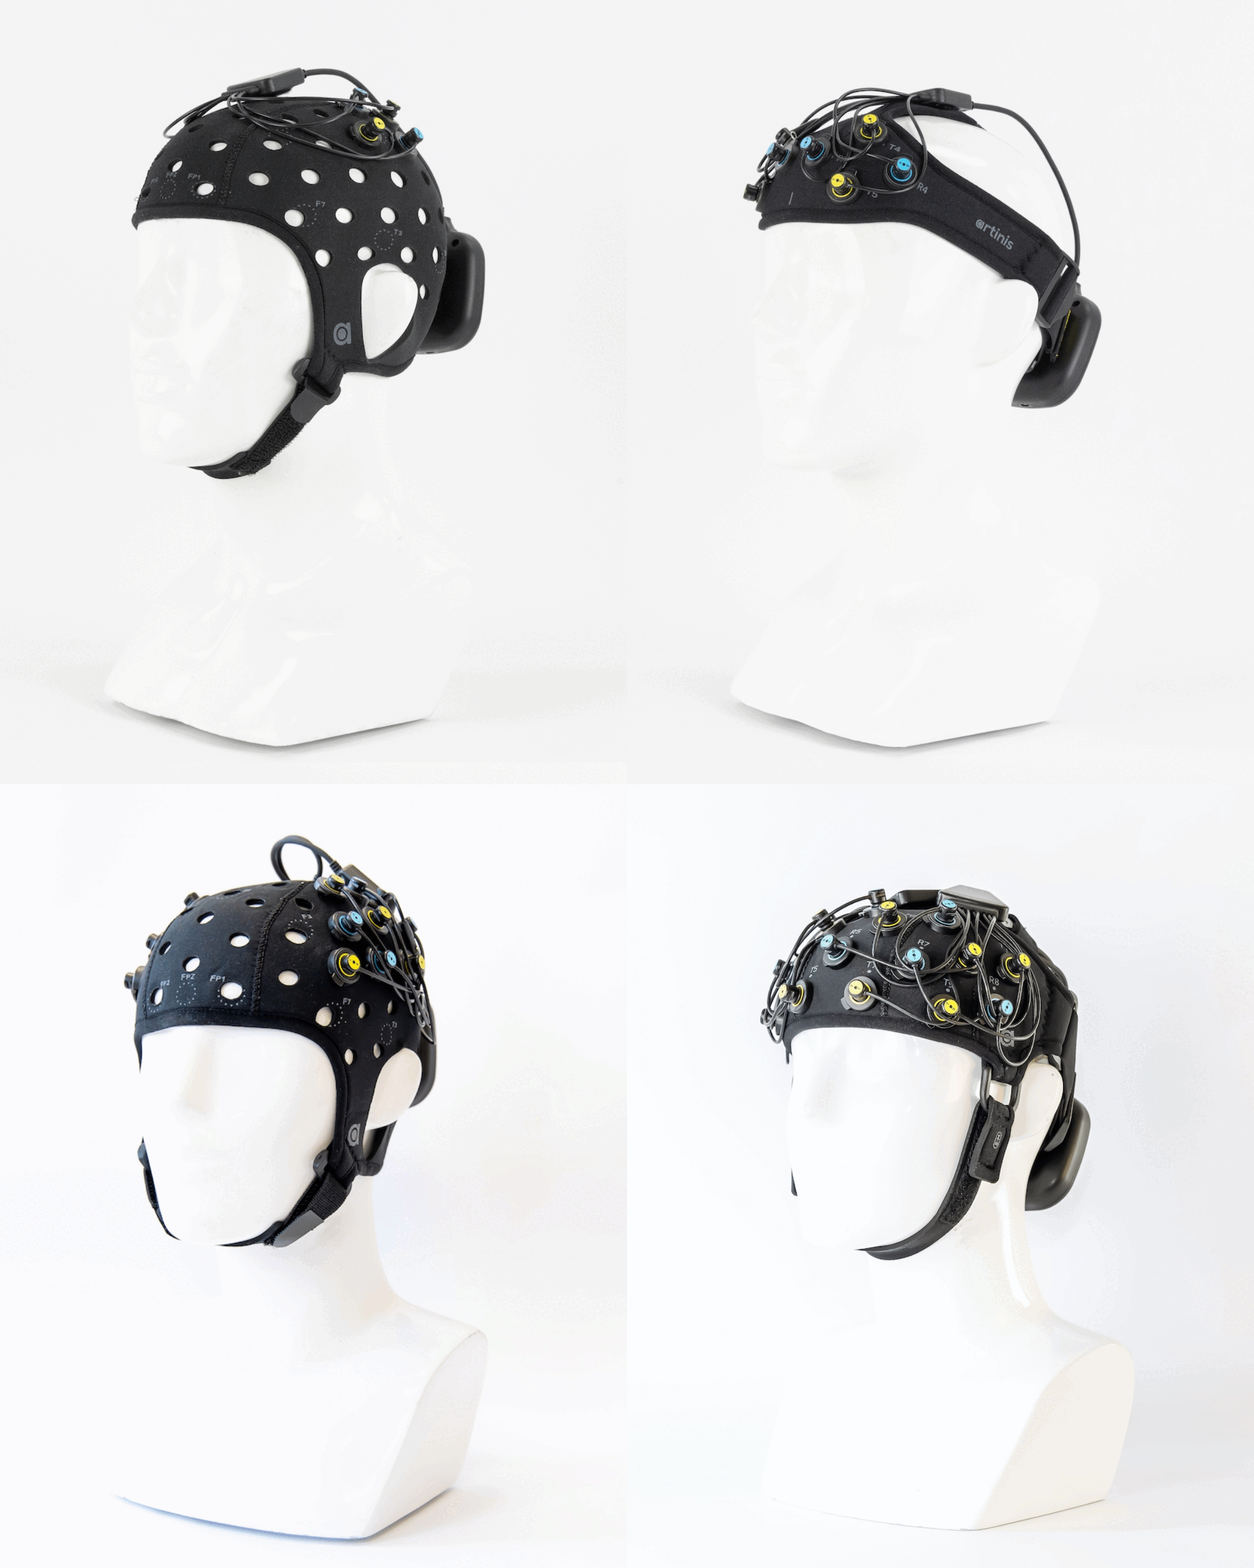
Currently, short separation channels are available in the PortaLite MKII, OxyMon, OctaMon, and the Brite system.
Please contact us at askforinfo@artinis.com if you already have a system and would like to upgrade it with short separation channel(s).
Short separation channel white paper
An updated and more detailed explanation of the short channel is available in the Short Separation Channels — Improving signal quality in NIRS and fNIRS measurements white paper.
References
Brigadoi, S., & Cooper, R. J. (2015). How short is short? Optimum source–detector distance for short-separation channels in functional near-infrared spectroscopy. Neurophotonics.
Sato, T., Nambu, I., Takeda, K., Aihara, T., Yamashita, O., Isogaya, Y., … Osu, R. (2016). Reduction of global interference of scalp-hemodynamics in functional near-infrared spectroscopy using short distance probes. NeuroImage, 141, 120–132.
Scarpa, F., Cutini, S., Scatturin, P., Dell, R., Sparacino, G., Boas, D. A., … Villringer, A. (2002). Bayesian filtering of human brain hemodynamic activity elicited by visual short-term maintenance recorded through functional nearinfrared spectroscopy (fNIRS). IEEE Eng. Med. Biol. Mag (Vol. 8). CRC Press.
Zhang, Q., Brown, E. N., & Strangman, G. E. (2007). Adaptive filtering for global interference cancellation and real-time recovery of evoked brain activity: a Monte Carlo simulation study. Journal of Biomedical Optics.
Zhang, Y., Tan, F., Xu, X., Duan, L., Liu, H., Tian, F., & Zhu, C.-Z. (2015). Multiregional functional near-infrared spectroscopy reveals globally symmetrical and frequency-specific patterns of superficial interference. Biomedical Optics Express.





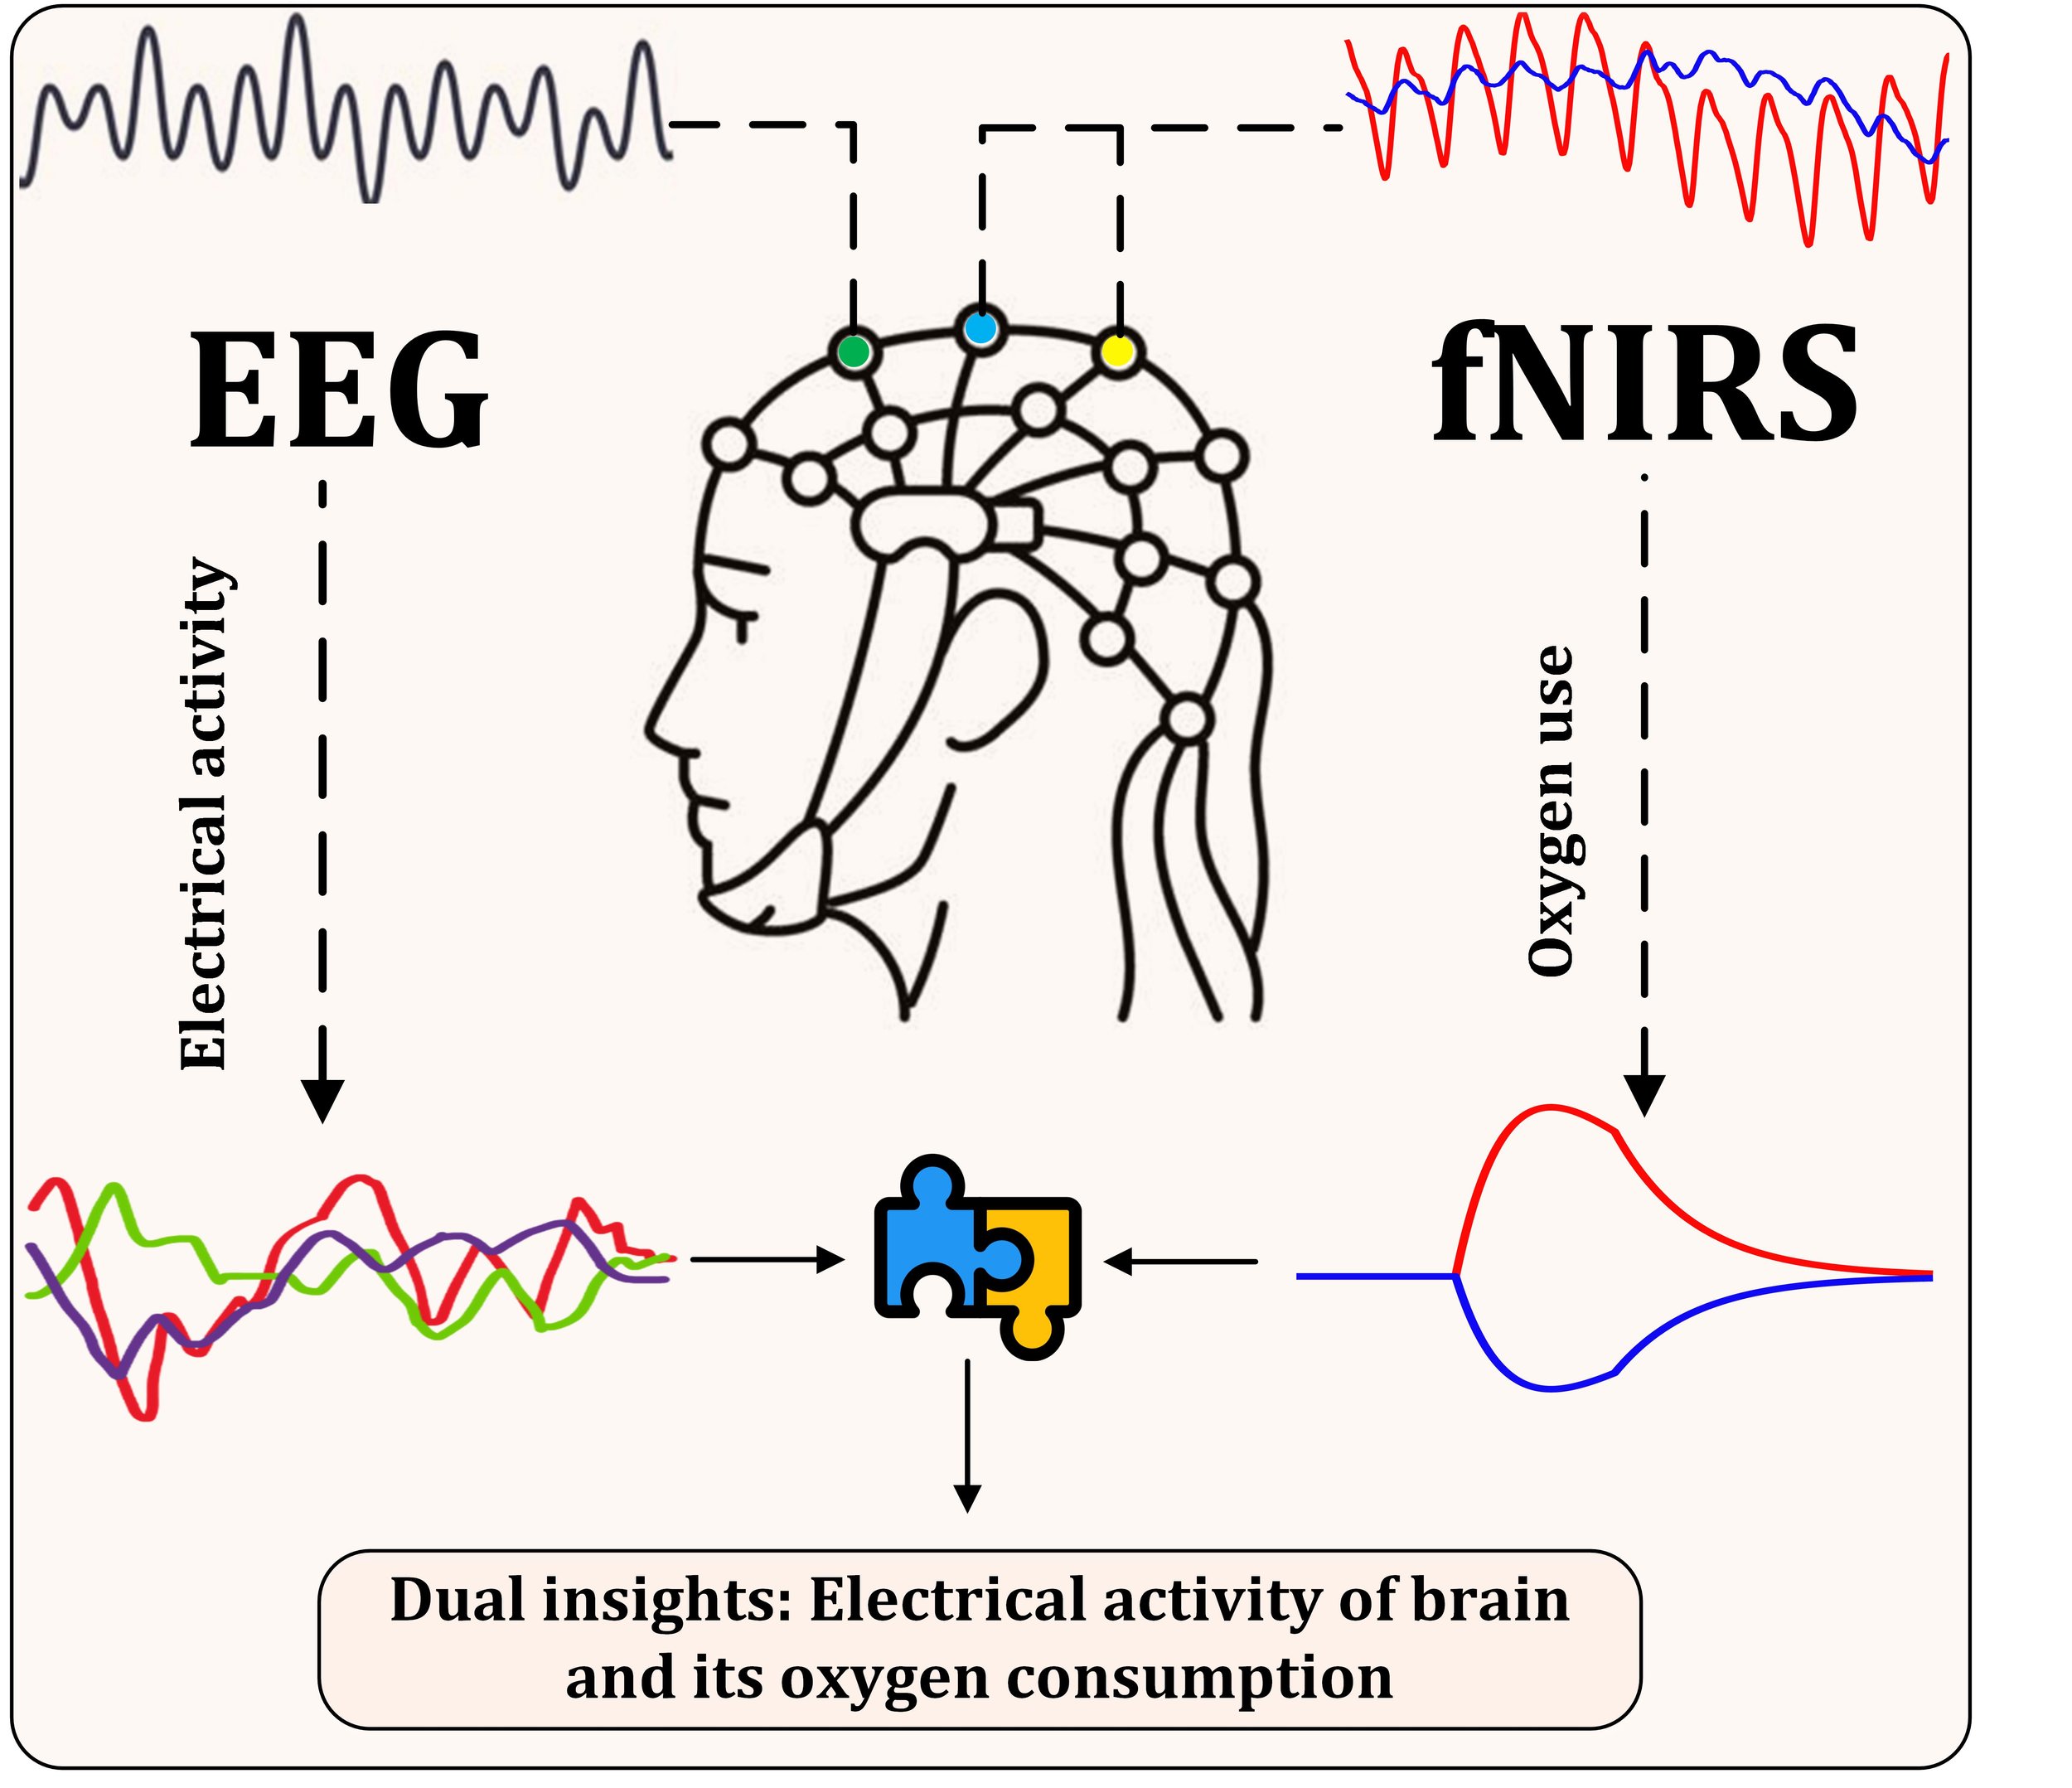

Combining fNIRS and EEG is gaining increasing popularity in neuroscience, allowing for the best of both worlds to be combined. One challenge in multimodality measurements can be interference (also known as crosstalk), especially when fNIRS optodes and EEG electrodes are placed close to each other. In this blog post, we demonstrate that it is possible to achieve high-quality EEG recordings without interference during simultaneous measurements with the Brite (fNIRS) and APEX (EEG) devices.